The St. Johns River Water Management District has an active continuous Water Quality monitoring network that is instrumented with YSI EXO2 Sondes with various probes (e.g., pH, Dissolved Oxygen) and Sea-Bird Scientific HydroCycle-PO4 phosphate sensors. We have three field teams responsible from anywhere from 1 to 12 stations at any given time, with different sonde and probe/parameter configurations depending on project needs.
It is important that we keep these stations running to support District projects, so we want to know when stations may need to be serviced. I developed several different types of dashboards to help field staff stay on top of each of the stations, to assist with station assessments and troubleshooting. One of these, the Status Dashboard, is designed to be the first step for field staff in their office-based station assessments.
Status dashboards
At a glance, the Status Dashboard helps field staff determine whether a station may have communication, sonde, or probe problems.
This is the basic layout of the dashboard:
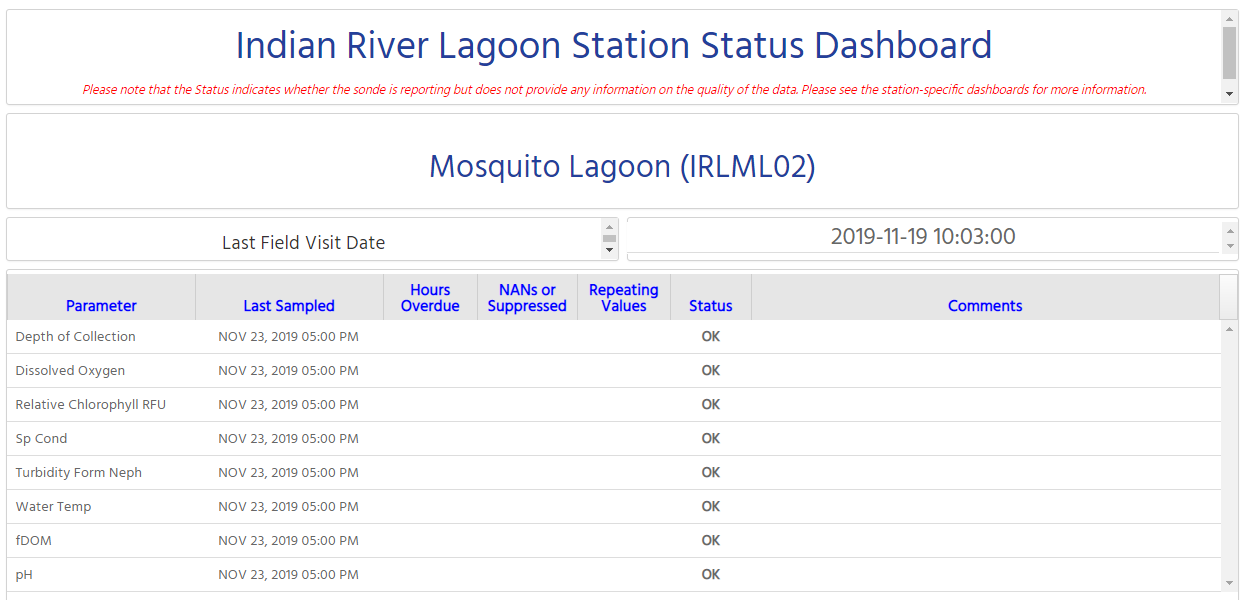
With this dashboard, staff can scroll to different stations (for example, this dashboard includes 6 stations laid out just like the Mosquito Lagoon block shown here) and determine whether there are any immediate issues with the station.
They can look at the Status column to determine whether there are any problems. If all is OK, as shown above, then they are encouraged to look at other dashboards to see whether they can identify any other problematic issues that aren’t easily assessed with this dashboard.
When a problem arises, the dashboard indicates a Status of CHECK, as shown below:
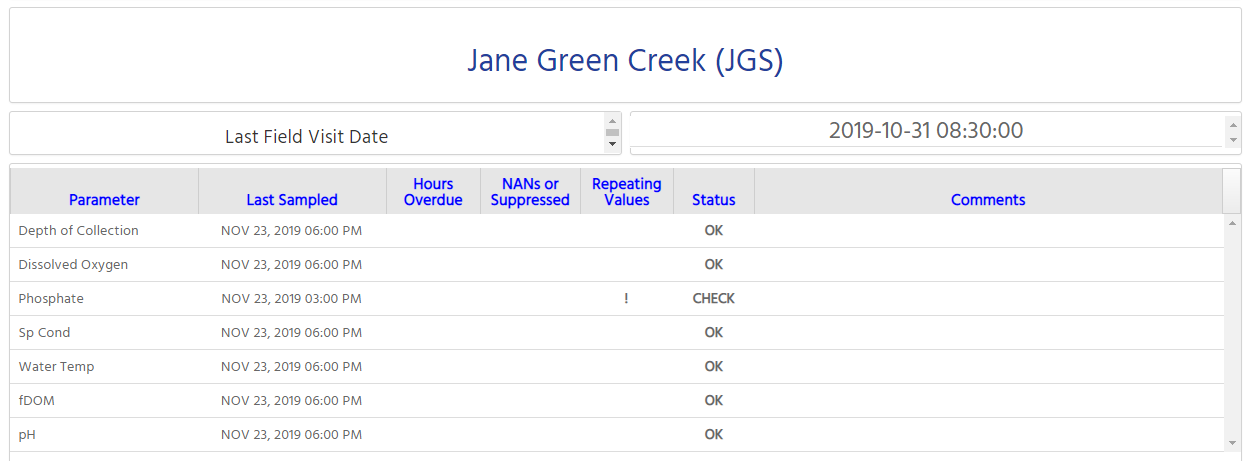
Field staff can then look at the Hours Overdue, NANs or Suppressed, and Repeating Values columns to determine what kind of problem may be occurring at the station. In the example above, there are repeating values occurring in the Phosphate data stream, which can sometimes indicate that there is a fault in the sensor.
Building the Dashboard
Free Text or HTML widgets
The first two blocks at the top of the dashboard are simple Free Text or HTML Widgets, containing simple HTML code like this:
<!DOCTYPE html>
<html>
<head>
<style>

h1 {
  margin-top: -25px;
  margin: 0px;
  text-align: center;
  font-size: 50px;
}

h3 {
  color: red;
  text-align: center;
  font-style: italic;
}
</style>
</head>
<body>

<h1>Indian River Lagoon Station Status Dashboard</h1>
<h3>Please note that the Status indicates whether the
sonde is reporting but does not provide any information
on the quality of the data.  Please see the station-specific
dashboards for more information.</h3>

</body>
</html>
Grid (Script-Based) widgets
The third row of widgets includes another Free Text or HTML widget and a Grid (Script-Based) widget to display a specific timestamp from a time series.
Field Visit timestamp widget
The Grid (Script-Based) widget relies on an SQL query in a script. This is built with a combination of two scripts, one Common script that can be used by multiple widgets and another Data Table script that is specific to that station.
The Common script, which is written using the AQUARIUS SupaScript language, looks like this (on GitHub here):
Function DashboardFieldVisitDateScript(ByRef Error As String, ByVal LocationIdentifier As String) As DataTable
  DataTable dt
  String error
  String sql

  sql = "SELECT d.endtime AS lastdate
           FROM w_location l
                LEFT JOIN w_dataset d
                ON l.locationid = d.locationid
          WHERE l.identifier = '" & LocationIdentifier & "'
            AND d.label = 'WQCS'"

  dt=DatabaseQuery(error, sql)
  DashboardFieldVisitDateScript = dt
End Function
This script looks at the W_DATASET table in the WebPortal table schema and finds the last recorded timestamp, which is in the ENDTIME column.
In order to generate the table, I created a Data Table script, filling in the LocationIdentifier token in the Common script (on GitHub here):
Function ML02FV(ByRef Error As String) As DataTable
  ML02FV = DashboardFieldVisitDateScript(Error, "33814526")
End Function
Next, I created a clone of the default Grid (Script-Based) Widget Template so I could customize the formatting. I modified the JavaScript block of the template, adding this chunk inside the Kendo UI Grid (.kendoGrid) section:
columns: [
    { field: "LASTDATE",
      width: "150px",
        attributes: {
            "class": "table-cell",
            style: "text-align: center; font-size: 30px; height: 30px"
    }
    }
],
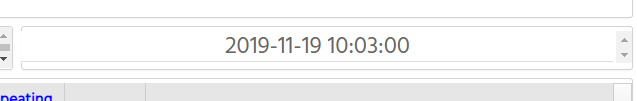
I created a Widget using the modified Grid (Script-Based) Widget Template, setting the GridId to Fixed and selecting the ML02FV Data Table in the Value box. The result is this simple widget on the dashboard:
Status table widget
The larger table is created using a similar process, with a more complex SQL query and additional formatting in the JavaScript block of the Widget Template.
The Common script for this larger table looks like this (see the file in the GitHub repo here):
Function DashboardDataTableScript(ByRef Error As String, ByVal LocationIdentifier As String, ByVal ParameterIdentifiers As String) As DataTable
  DataTable dt
  String error
  String sql

  sql =  "SELECT parameter AS param,
                 to_char(lastsampled, 'MON dd, yyyy hh:mi AM') AS last_sampled,
                 /* if the last reported timestamp is more than 6 hours old, report number of hours overdue */
                 CASE WHEN (-(EXTRACT(DAY FROM lastsampled - SYSTIMESTAMP)*24 + EXTRACT(HOUR FROM (lastsampled - SYSTIMESTAMP)))) > 6 THEN
                           (-(EXTRACT(DAY FROM lastsampled - SYSTIMESTAMP)*24 + EXTRACT(HOUR FROM (lastsampled - SYSTIMESTAMP)))) ELSE NULL END AS hours_overdue,
                 /* if it is reporting nans */
                 CASE WHEN (latest_all IS NULL AND maximum_all IS NULL AND minimum_all IS NULL
                            AND (-(EXTRACT(DAY FROM lastsampled - SYSTIMESTAMP)*24 + EXTRACT(HOUR FROM (lastsampled - SYSTIMESTAMP)))) <= 6)
                            THEN '!' ELSE NULL END AS nans,
                 /* if there are repeating values */
                 CASE WHEN (maximum_all = minimum_all)
                            THEN '!' ELSE NULL END AS repeating_values,
                 /* if there are any problems (overdue, nans, repeating values)
                    CHECK if there are no comments yet or if the last sample date is less than 7 days ago
                    DOWN if there are comments or the last sample date is more than 7 days ago*/
                 CASE WHEN ((-(EXTRACT(DAY FROM lastsampled - SYSTIMESTAMP)*24 + EXTRACT(HOUR FROM (lastsampled - SYSTIMESTAMP)))) > 6
                            OR (latest_all IS NULL AND maximum_all IS NULL AND minimum_all IS NULL
                            AND (-(EXTRACT(DAY FROM lastsampled - SYSTIMESTAMP)*24 + EXTRACT(HOUR FROM (lastsampled - SYSTIMESTAMP)))) <= 6)
                            OR maximum_all = minimum_all) AND (comments IS NOT NULL OR
                            (-(EXTRACT(DAY FROM lastsampled - SYSTIMESTAMP)*24 + EXTRACT(HOUR FROM (lastsampled - SYSTIMESTAMP)))) > 168) THEN 'DOWN'
                            WHEN ((-(EXTRACT(DAY FROM lastsampled - SYSTIMESTAMP)*24 + EXTRACT(HOUR FROM (lastsampled - SYSTIMESTAMP)))) > 6
                            OR (latest_all IS NULL AND maximum_all IS NULL AND minimum_all IS NULL
                            AND (-(EXTRACT(DAY FROM lastsampled - SYSTIMESTAMP)*24 + EXTRACT(HOUR FROM (lastsampled - SYSTIMESTAMP)))) <= 6)
                            OR maximum_all = minimum_all) AND comments IS NULL THEN 'CHECK'
                            WHEN lastsampled IS NULL THEN 'NO DATA'
                            ELSE 'OK' END AS status,
                 /* get comments when there are problems (overdue, nans, repeating values) */
                 CASE WHEN ((-(EXTRACT(DAY FROM lastsampled - SYSTIMESTAMP)*24 + EXTRACT(HOUR FROM (lastsampled - SYSTIMESTAMP)))) > 6
                            OR (latest_all IS NULL AND maximum_all IS NULL AND minimum_all IS NULL
                            AND (-(EXTRACT(DAY FROM lastsampled - SYSTIMESTAMP)*24 + EXTRACT(HOUR FROM (lastsampled - SYSTIMESTAMP)))) <= 6)
                            OR maximum_all = minimum_all)
                            THEN CAST(comments AS NVARCHAR2(200)) ELSE CAST('' AS NVARCHAR2(20)) END AS comments
           FROM
          (WITH t AS
                (SELECT did, lastsampled, parameter,
                        listagg(latest, '') WITHIN GROUP (ORDER BY parameter) AS latest_all,
                        listagg(maximum, '') WITHIN GROUP (ORDER BY parameter) AS maximum_all,
                        listagg(minimum, '') WITHIN GROUP (ORDER BY parameter) AS minimum_all
                   FROM
                        (SELECT d.datasetid AS did, d.endtime AS lastsampled, p.displayid AS parameter,
                                sv.value AS statvalue, substr(sd.name,1,3) AS statname
                           FROM w_dataset d
                                LEFT JOIN w_location l
                                ON d.locationid = l.locationid
                                LEFT JOIN w_parameter p
                                ON d.parameterid = p.parameterid
                                LEFT JOIN w_statvalue sv
                                ON d.datasetid = sv.datasetid
                                LEFT JOIN w_statdef sd
                                ON sv.statisticdefinitionid = sd.statisticdefinitionid
                          WHERE p.identifier IN " & ParameterIdentifiers & "
                          AND d.label IN ('YSI', 'SUNA', 'CycleP')
                          AND l.identifier = '" & LocationIdentifier & "'
                          AND (sd.name LIKE 'LATEST%' OR sd.name LIKE 'MAX%' OR sd.name LIKE 'MIN%' OR sd.name IS NULL)
                          ORDER BY p.displayid ASC)
                    pivot
                          (sum(statvalue) FOR statname IN ('LAT' latest, 'MAX' maximum, 'MIN' minimum))
                 GROUP BY did, lastsampled, parameter)
          SELECT t.*, d.comments comments
            FROM t
                 LEFT JOIN w_dataset d
                 ON t.did = d.datasetid)
           ORDER BY parameter"

  dt=DatabaseQuery(error,sql)
  DashboardDataTableScript = dt
End Function
The Data Table script that fills in the ParameterIdentifiers and LocationIdentifier tokens in the Common script looks like this (on GitHub here):
Function ML02(ByRef Error As String) As DataTable
  ML02 = DashboardDataTableScript(Error, "33814526", "'Depth','SpCond','WO','fDOM','PH','WTFNU','TW','rClorRFU'")
End Function
I created a new clone of the Grid (Script-Based) Widget Template, inserting this chunk inside the Kendo UI Grid (.kendoGrid) section:
columns: [
            { field: "PARAM",
              title: "Parameter",
              width: "40px",
                attributes: {
                    "class": "table-cell",
                    style: "text-align: left; font-size: 18px; height: 18px"
            },
                headerAttributes: {
                    style: "text-align: center; font-size: 20px; color: blue; white-space: normal"
                }
            },
            { field: "LAST_SAMPLED",
              title: "Last Sampled",
              width: "40px",
                attributes: {
                    "class": "table-cell",
                    style: "text-align: center; font-size: 18px; height: 18px"
            },
                headerAttributes: {
                    style: "text-align: center; font-size: 20px; color: Blue; white-space: normal"
                }
            },
            { field: "HOURS_OVERDUE",
              title: "Hours Overdue",
              width: "20px",
                attributes: {
                    "class": "table-cell",
                    style: "text-align: center; font-size: 18px; height: 18px; font-weight: bold"
            },
                headerAttributes: {
                    style: "text-align: center; font-size: 20px; color: blue; white-space: normal"
                }
            },
            { field: "NANS",
              title: "NANs or Suppressed",
              width: "22px",
                attributes: {
                    "class": "table-cell",
                    style: "text-align: center; font-size: 18px; height: 18px; font-weight: bold"
            },
                headerAttributes: {
                    style: "text-align: center; font-size: 20px; color: blue; white-space: normal"
                }
            },
            { field: "REPEATING_VALUES",
              title: "Repeating Values",
              width: "20px",
                attributes: {
                    "class": "table-cell",
                    style: "text-align: center; font-size: 18px; height: 18px; font-weight: bold"
            },
                headerAttributes: {
                    style: "text-align: center; font-size: 20px; color: blue; white-space: normal"
                }
            },
            { field: "STATUS",
              title: "Status",
              width: "18px",
              //template: '#=Getvalue(STATUS)#',
                attributes: {
                    "class": "table-cell",
                    style: "text-align: center; font-size: 18px; height: 18px; font-weight: bold"
            },
                headerAttributes: {
                    style: "text-align: center; font-size: 20px; color: blue; white-space: normal"
                }
            },
            { field: "COMMENTS",
              title: "Comments",
              width: "100px",
                attributes: {
                    "class": "table-cell",
                    style: "text-align: left; font-size: 18px; height: 18px; font-weight: bold"
            },
                headerAttributes: {
                    style: "text-align: center; font-size: 20px; color: blue; white-space: normal"
                }
            }
         ],
I also changed the scrollable and sortable settings within the Kendo UI Grid block and added a resizable setting:
scrollable: {virtual:false},
sortable: false,
resizable: true,
Lastly, I modified the final line in the Widget Template, changing the setting from hide to show like this:
$("###WIDGETIDENTIFIER## .widget-box .grid .k-grid-header").show("font-size: 35px");
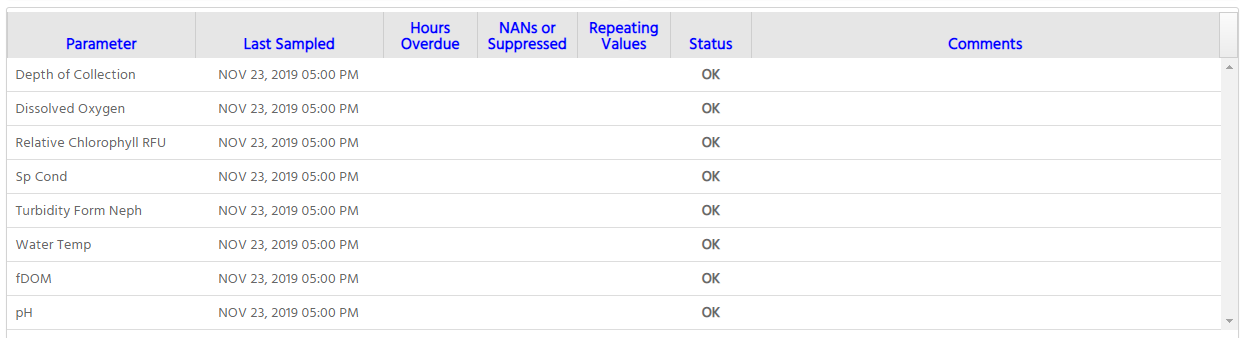
Finally, I created a Widget using the custom Grid (Script-Based) Widget Template for these larger tables, setting the GridId to Fixed and selecting the ML02 Data Table in the Value box. The result is this widget on the dashboard:
I repeated this process for all stations and parameters, and assembled a custom dashboard for each project.
Dashboards in Use
Field staff use the Status Dashboards to routinely evaluate the status of each of the stations they are responsible for. This is combined with Dashboards involving time series visualizations (graphs) to ensure that the continuous monitoring program keeps running smoothly.