I was trying to get the period of record for data in the St. Johns River Water Management District’s Hydstra database, which houses hydrologic data. I found the report type HYREP PERIOD, which produces an output that contains the period of record information I needed. However, it was not in a convenient format to allow for easy joining to other Oracle-based tables.
This project steps through the data cleaning process I used to get the data into a usable format in R. I include brief snapshots (a few rows) of the data frames to illustrate each of the cleaning steps.
HYREP PERIOD data output
The HYREP PERIOD report produces an output that would be very good on a small scale (i.e., looking at only a few stations at a time).
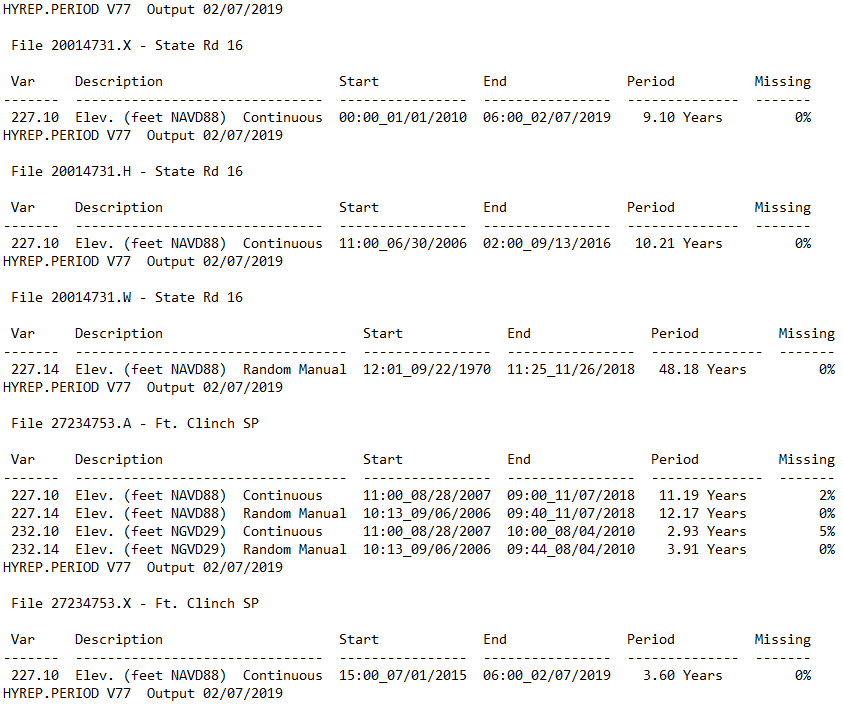
With hundreds of stations, it made more sense to reformat this output to extract all of the relevant data into a table structure. There is a site identifier in the line above each block of data, and it is important that this information is linked to the data. Additionally, there are many rows that are not needed.
Importing the data
With unstructured data like this, the read_lines function from the readr package loads the file line by line. The text file contains many empty rows, so setting the skip_empty_rows argument to TRUE removes these rows. Wrapping read_lines in data.frame ensures that we start working with table-based data right away.
hy <- data.frame(V1 = read_lines("HY_POR_WATERCAT.txt", skip_empty_rows = T))
| V1 |
|---|
| HYREP.PERIOD V77 Output 02/07/2019 |
| File 20014731.A - State Rd 16 |
| Var Description Start End Period Missing |
| ——- ———————————- —————- —————- ————– ——- |
| 227.10 Elev. (feet NAVD88) Continuous 11:00_06/30/2006 11:00_07/10/2018 12.03 Years 0% |
| 227.14 Elev. (feet NAVD88) Random Manual 12:01_09/22/1970 11:35_07/10/2018 47.80 Years 0% |
| 232.10 Elev. (feet NGVD29) Continuous 11:00_06/30/2006 11:00_03/01/2010 3.67 Years 0% |
| 232.14 Elev. (feet NGVD29) Random Manual 12:01_09/22/1970 11:14_03/01/2010 39.44 Years 0% |
| HYREP.PERIOD V77 Output 02/07/2019 |
| File 20014731.X - State Rd 16 |
Cleaning the data
Remove unnecessary rows
There are a number of lines that do not contain any data of interest. These lines include the strings “–”, “HYREP.PERIOD”, “Var”, “dup/”, or “Index”. The grepl function searches for any of these strings, and the filter function in the dplyr package allows us to omit any of these lines. In addition, the str_trim function in the stringr package strips whitespace from the start and end of each line.
hy <- hy %>%
    filter(!grepl("--|HYREP.PERIOD|Var|dup/|Index", V1)) %>%
    mutate(V1 = str_trim(V1))
| V1 |
|---|
| File 20014731.A - State Rd 16 |
| 227.10 Elev. (feet NAVD88) Continuous 11:00_06/30/2006 11:00_07/10/2018 12.03 Years 0% |
| 227.14 Elev. (feet NAVD88) Random Manual 12:01_09/22/1970 11:35_07/10/2018 47.80 Years 0% |
| 232.10 Elev. (feet NGVD29) Continuous 11:00_06/30/2006 11:00_03/01/2010 3.67 Years 0% |
| 232.14 Elev. (feet NGVD29) Random Manual 12:01_09/22/1970 11:14_03/01/2010 39.44 Years 0% |
| File 20014731.X - State Rd 16 |
| 227.10 Elev. (feet NAVD88) Continuous 00:00_01/01/2010 06:00_02/07/2019 9.10 Years 0% |
| File 20014731.H - State Rd 16 |
| 227.10 Elev. (feet NAVD88) Continuous 11:00_06/30/2006 02:00_09/13/2016 10.21 Years 0% |
| File 20014731.W - State Rd 16 |
Create a Site column
The structure of the data is now a line with information about the site followed by one or more lines of data. The site designator is an eight digit number included in each line above the data blocks. The str_extract function from stringr can be used to extract those eight consecutive digits using a regular expression. The fill function from the tidyr package fills down the values in the Site column so that each data row is associated with the correct Site. Once the Site variable is extracted, the rows containing the string “File” can be omitted.
hy <- hy %>%
    mutate(Site = str_extract(V1, "\\d{8}")) %>%
    select(Site, V1) %>%
    fill(Site) %>%
    filter(!grepl("File", V1))
| Site | V1 |
|---|---|
| 20014731 | 227.10 Elev. (feet NAVD88) Continuous 11:00_06/30/2006 11:00_07/10/2018 12.03 Years 0% |
| 20014731 | 227.14 Elev. (feet NAVD88) Random Manual 12:01_09/22/1970 11:35_07/10/2018 47.80 Years 0% |
| 20014731 | 232.10 Elev. (feet NGVD29) Continuous 11:00_06/30/2006 11:00_03/01/2010 3.67 Years 0% |
| 20014731 | 232.14 Elev. (feet NGVD29) Random Manual 12:01_09/22/1970 11:14_03/01/2010 39.44 Years 0% |
| 20014731 | 227.10 Elev. (feet NAVD88) Continuous 00:00_01/01/2010 06:00_02/07/2019 9.10 Years 0% |
| 20014731 | 227.10 Elev. (feet NAVD88) Continuous 11:00_06/30/2006 02:00_09/13/2016 10.21 Years 0% |
Create additional columns
Additional columns can be created by extracting pieces of the V1 column using str_extract and regular expressions. Only some of the variables and subvariables needed to be retained, so these can be filtered out.
hy <- hy %>%
    mutate(Variable = str_extract(V1, "^\\d+\\.\\d+"),
           StartDate = as.POSIXct(str_extract(V1, "\\d{2}\\:\\d{2}\\_\\d{2}/\\d{2}/\\d{4}"),
                                  format = "%H:%M_%m/%d/%Y", tz = "EST"),
           EndDate = as.POSIXct(str_sub(str_extract(V1, "\\d{2}\\:\\d{2}\\_\\d{2}/\\d{2}/\\d{4}.*?(\\d{2}\\:\\d{2}\\_\\d{2}/\\d{2}/\\d{4})"), -16),
                                format = "%H:%M_%m/%d/%Y", tz = "EST"),
           Var = as.numeric(str_extract(Variable, ".*(?=\\.)")),
           SubVar = as.numeric(str_extract(Variable, "(\\.[^\\.]+)$"))) %>%
    filter(SubVar %in% c(0.1, 0.14), !(Var %in% c(104, 229, 252, 300, 551, 2327))) %>%
    select(Site, Variable, Var, SubVar, StartDate, EndDate, V1)
| Site | Variable | Var | SubVar | StartDate | EndDate | V1 |
|---|---|---|---|---|---|---|
| 20014731 | 227.10 | 227 | 0.1 | 2006-06-30 11:00:00 | 2018-07-10 11:00:00 | 227.10 Elev. (feet NAVD88) Continuous 11:00_06/30/2006 11:00_07/10/2018 12.03 Years 0% |
| 20014731 | 227.14 | 227 | 0.14 | 1970-09-22 12:01:00 | 2018-07-10 11:35:00 | 227.14 Elev. (feet NAVD88) Random Manual 12:01_09/22/1970 11:35_07/10/2018 47.80 Years 0% |
| 20014731 | 232.10 | 232 | 0.1 | 2006-06-30 11:00:00 | 2010-03-01 11:00:00 | 232.10 Elev. (feet NGVD29) Continuous 11:00_06/30/2006 11:00_03/01/2010 3.67 Years 0% |
| 20014731 | 232.14 | 232 | 0.14 | 1970-09-22 12:01:00 | 2010-03-01 11:14:00 | 232.14 Elev. (feet NGVD29) Random Manual 12:01_09/22/1970 11:14_03/01/2010 39.44 Years 0% |
| 20014731 | 227.10 | 227 | 0.1 | 2010-01-01 | 2019-02-07 06:00:00 | 227.10 Elev. (feet NAVD88) Continuous 00:00_01/01/2010 06:00_02/07/2019 9.10 Years 0% |
| 20014731 | 227.10 | 227 | 0.1 | 2006-06-30 11:00:00 | 2016-09-13 02:00:00 | 227.10 Elev. (feet NAVD88) Continuous 11:00_06/30/2006 02:00_09/13/2016 10.21 Years 0% |
Summarize the data
Group rows
I was interested in the period of record for each variable and site combination, so the group_by and summarize functions from dplyr can be used to extract the earliest start date and the latest end date.
hy_sum <- hy %>%
    group_by(Site, Var) %>%
    summarize(Start = min(StartDate), End = max(EndDate))
| Site | Var | Start | End |
|---|---|---|---|
| 00100109 | 11 | 1990-08-03 16:15:00 | 2019-02-07 06:00:00 |
| 00171258 | 11 | 1991-10-14 15:31:00 | 2019-02-07 06:00:00 |
| 00220012 | 227 | 1993-05-13 14:09:00 | 2018-08-03 08:56:00 |
| 00220012 | 232 | 1993-05-13 14:09:00 | 2010-04-13 12:05:00 |
| 00220012 | 233 | 1993-05-13 14:09:00 | 2019-02-07 06:00:00 |
| 00220012 | 262 | 1993-05-13 14:09:00 | 2018-09-26 09:14:00 |
Add Event column
The database I needed to join to these data lists variables as text-based Event Types, as shown in this crosswalk table.
var_xwalk <- read_csv("Event_Var_Xwalk.csv", col_types = "cd")
| Event Type | Var |
|---|---|
| Rain (RN) | 11 |
| Vrain | 11 |
| Water Level (WL) | 227 |
| Water Level (WL) | 232 |
| Water Level (WL) - Gauge Height | 233 |
| Water Level (WL) | 233 |
| Velocity | 237 |
| Discharge | 262 |
The crosswalk table can be used to create an Event column that holds the Event Types. Because there are multiple possible event types for each variable, the first step is to include all possible event types in the Event column.
hy_sum <- hy_sum %>%
    mutate(Event = paste(as.character(unique(var_xwalk$`Event Type`[var_xwalk$Var == Var])),
                         collapse = ";", sep = " "))
| Site | Var | Start | End | Event |
|---|---|---|---|---|
| 00100109 | 11 | 1990-08-03 16:15:00 | 2019-02-07 06:00:00 | Rain (RN);Vrain |
| 00171258 | 11 | 1991-10-14 15:31:00 | 2019-02-07 06:00:00 | Rain (RN);Vrain |
| 00220012 | 227 | 1993-05-13 14:09:00 | 2018-08-03 08:56:00 | Water Level (WL);Water Level (WL) - Gauge Height |
| 00220012 | 232 | 1993-05-13 14:09:00 | 2010-04-13 12:05:00 | Water Level (WL);Water Level (WL) - Gauge Height |
| 00220012 | 233 | 1993-05-13 14:09:00 | 2019-02-07 06:00:00 | Water Level (WL);Water Level (WL) - Gauge Height |
| 00220012 | 262 | 1993-05-13 14:09:00 | 2018-09-26 09:14:00 | Water Level (WL);Water Level (WL) - Gauge Height |
When multiple event types are present, these can be split apart using the base strsplit function, and then each separate event type can be in its own row using the unnest function from tidyr.
hy_sum <- hy_sum %>%
    mutate(Event = strsplit(as.character(Event), ";")) %>%
    unnest(Event)
| Site | Var | Start | End | Event |
|---|---|---|---|---|
| 00100109 | 11 | 1990-08-03 16:15:00 | 2019-02-07 06:00:00 | Rain (RN) |
| 00100109 | 11 | 1990-08-03 16:15:00 | 2019-02-07 06:00:00 | Vrain |
| 00171258 | 11 | 1991-10-14 15:31:00 | 2019-02-07 06:00:00 | Rain (RN) |
| 00171258 | 11 | 1991-10-14 15:31:00 | 2019-02-07 06:00:00 | Vrain |
| 00220012 | 227 | 1993-05-13 14:09:00 | 2018-08-03 08:56:00 | Water Level (WL) |
| 00220012 | 227 | 1993-05-13 14:09:00 | 2018-08-03 08:56:00 | Water Level (WL) - Gauge Height |
Group rows
Finally, I can summarize over each Site and Event combination to get the period of record of interest.
hy_sum <- hy_sum %>%
    group_by(Site, Event) %>%
    summarize(Start = min(Start), End = max(End))
| Site | Event | Start | End |
|---|---|---|---|
| 00100109 | Rain (RN) | 1990-08-03 16:15:00 | 2019-02-07 06:00:00 |
| 00100109 | Vrain | 1990-08-03 16:15:00 | 2019-02-07 06:00:00 |
| 00171258 | Rain (RN) | 1991-10-14 15:31:00 | 2019-02-07 06:00:00 |
| 00171258 | Vrain | 1991-10-14 15:31:00 | 2019-02-07 06:00:00 |
| 00220012 | Water Level (WL) | 1993-05-13 14:09:00 | 2019-02-07 06:00:00 |
| 00220012 | Water Level (WL) - Gauge Height | 1993-05-13 14:09:00 | 2019-02-07 06:00:00 |
The resulting data frame can be joined with Oracle tables containing matching Site and Event fields.